Franke’s Oscilloscope
Franke’s Oscilloscope
In the interview of Herbert W. Franke by Georg Bak for Right Click Save. April 14, 2022 (https://www.rightclicksave.com/article/herbert-w-franke-on-art-after-the-nft). We find a historical image of Herbert in front of his analog computer with output device oscillograph.
Franke’s oscillograms are significant because they are harbingers of a new era. Most were produced in the mid-1950s. He was one of the first individuals to use computer technology to generate computer graphics/computer art. As he stared at a tiny screen he would compose/record its output. Using photography, he would hold a camera in hand, often moving the camera in front of a cathode ray tube to capture the light. Later he would develop his film and print his captured images as serigraphs. In the early days many artists relied on traditional media to present their visions of the nascent imagery of computer art as graphic output devices did not exist.
In this work we wanted to digitally recreate the environment and the experience that produced the electronic imagery that so fascinated Herbert. I challenged my long-time friend and collaborator by showing him a couple of Oscillograms I acquired from Herbert in a trade, to see what we could come up with. Of course, it was Chris, a brilliant mathematician and programmer, who wrote the underlying algorithm that we share with you in this NFT. Chris describes it as follows:
Begin with a pair of parametric equations, each consisting of several sine waves of various frequencies. Plotted against each other these would create a smooth closed curve. Rather than simply drawing this curve, for each of hundreds of thousands of points along the curve a single point is drawn, in a random direction from the curve, at a distance that varies smoothly along the curve. This makes the curve appear pipe-like and gives the illusions of depth and transparency. It is also responsible for making the image appear grainy.
I will add that the algorithm is written in plain JavaScript and it is computationally intense. It will take a few seconds to generate each new iteration but, oh my, is it worth it. Imagine you are Herbert W. Franke staring at your little CRT seeing the future.
Minting:
0/0Price:
0.0000Ξ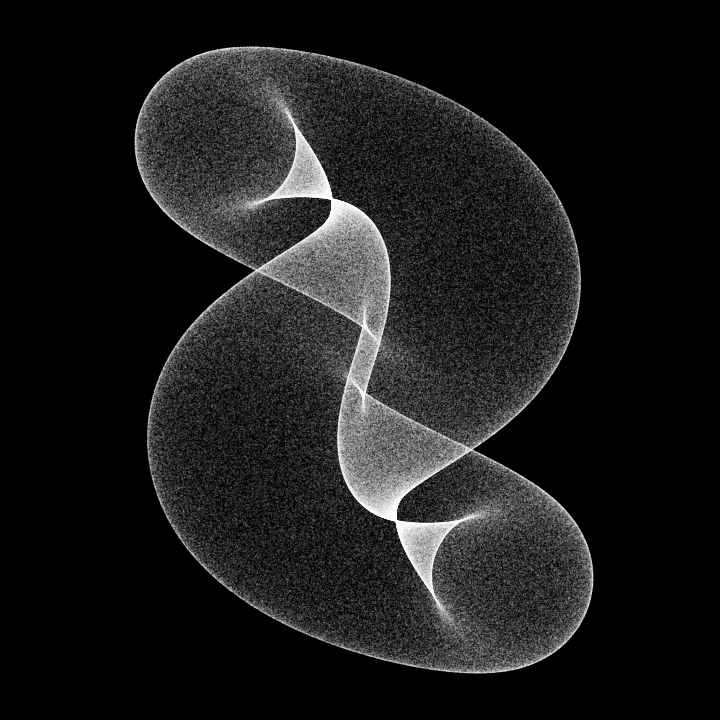
In the interview of Herbert W. Franke by Georg Bak for Right Click Save. April 14, 2022 (https://www.rightclicksave.com/article/herbert-w-franke-on-art-after-the-nft). We find a historical image of Herbert in front of his analog computer with output device oscillograph.
Franke’s oscillograms are significant because they are harbingers of a new era. Most were produced in the mid-1950s. He was one of the first individuals to use computer technology to generate computer graphics/computer art. As he stared at a tiny screen he would compose/record its output. Using photography, he would hold a camera in hand, often moving the camera in front of a cathode ray tube to capture the light. Later he would develop his film and print his captured images as serigraphs. In the early days many artists relied on traditional media to present their visions of the nascent imagery of computer art as graphic output devices did not exist.
In this work we wanted to digitally recreate the environment and the experience that produced the electronic imagery that so fascinated Herbert. I challenged my long-time friend and collaborator by showing him a couple of Oscillograms I acquired from Herbert in a trade, to see what we could come up with. Of course, it was Chris, a brilliant mathematician and programmer, who wrote the underlying algorithm that we share with you in this NFT. Chris describes it as follows:
Begin with a pair of parametric equations, each consisting of several sine waves of various frequencies. Plotted against each other these would create a smooth closed curve. Rather than simply drawing this curve, for each of hundreds of thousands of points along the curve a single point is drawn, in a random direction from the curve, at a distance that varies smoothly along the curve. This makes the curve appear pipe-like and gives the illusions of depth and transparency. It is also responsible for making the image appear grainy.
I will add that the algorithm is written in plain JavaScript and it is computationally intense. It will take a few seconds to generate each new iteration but, oh my, is it worth it. Imagine you are Herbert W. Franke staring at your little CRT seeing the future.
Franke’s oscillograms are significant because they are harbingers of a new era. Most were produced in the mid-1950s. He was one of the first individuals to use computer technology to generate computer graphics/computer art. As he stared at a tiny screen he would compose/record its output. Using photography, he would hold a camera in hand, often moving the camera in front of a cathode ray tube to capture the light. Later he would develop his film and print his captured images as serigraphs. In the early days many artists relied on traditional media to present their visions of the nascent imagery of computer art as graphic output devices did not exist.
In this work we wanted to digitally recreate the environment and the experience that produced the electronic imagery that so fascinated Herbert. I challenged my long-time friend and collaborator by showing him a couple of Oscillograms I acquired from Herbert in a trade, to see what we could come up with. Of course, it was Chris, a brilliant mathematician and programmer, who wrote the underlying algorithm that we share with you in this NFT. Chris describes it as follows:
Begin with a pair of parametric equations, each consisting of several sine waves of various frequencies. Plotted against each other these would create a smooth closed curve. Rather than simply drawing this curve, for each of hundreds of thousands of points along the curve a single point is drawn, in a random direction from the curve, at a distance that varies smoothly along the curve. This makes the curve appear pipe-like and gives the illusions of depth and transparency. It is also responsible for making the image appear grainy.
I will add that the algorithm is written in plain JavaScript and it is computationally intense. It will take a few seconds to generate each new iteration but, oh my, is it worth it. Imagine you are Herbert W. Franke staring at your little CRT seeing the future.